This page contains an overview of advanced analytics, operational research and data science techniques and their possible applications.
Want to suggest an addition to this page? Head to our contributor guide to find out more - coding entirely optional.
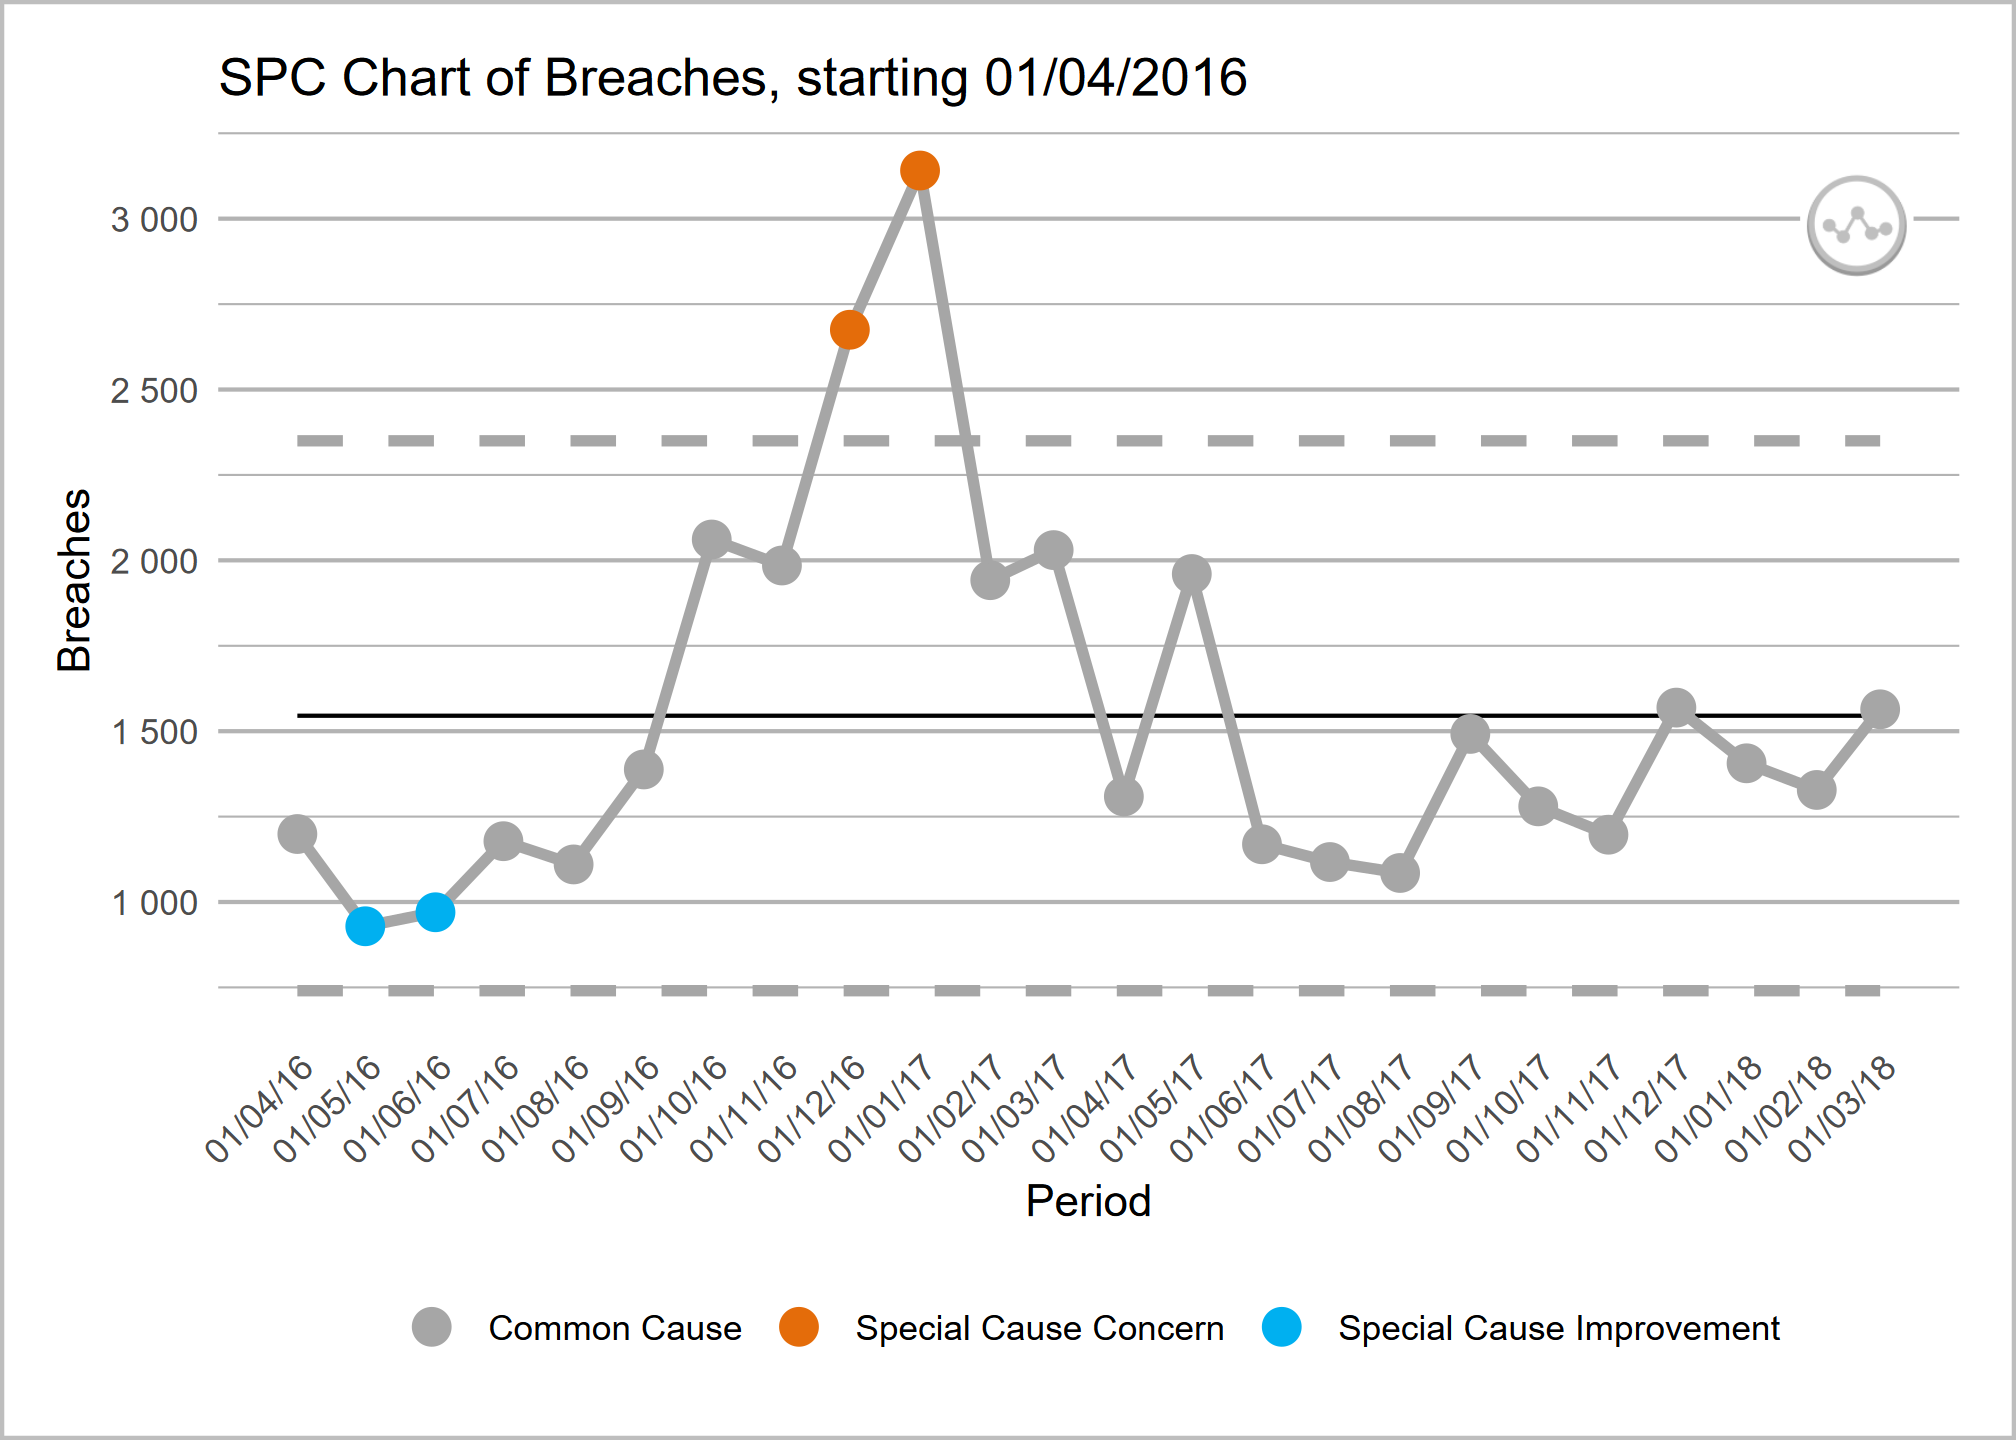
SPC charts are a useful tool for monitoring and reporting, allowing KPIs to be looked at over time and in the context of expected variation, moving away from some of the pitfalls of traditional RAG reporting and providing insights into trends and, if there is a target, whether it is likely to be reliably met.
No matching items