This page contains a showcase of graph types of use in healthcare contexts, including code snippets so you can recreate them yourself.
Want to suggest an addition to this page? Head to our contributor guide to find out more - coding entirely optional.
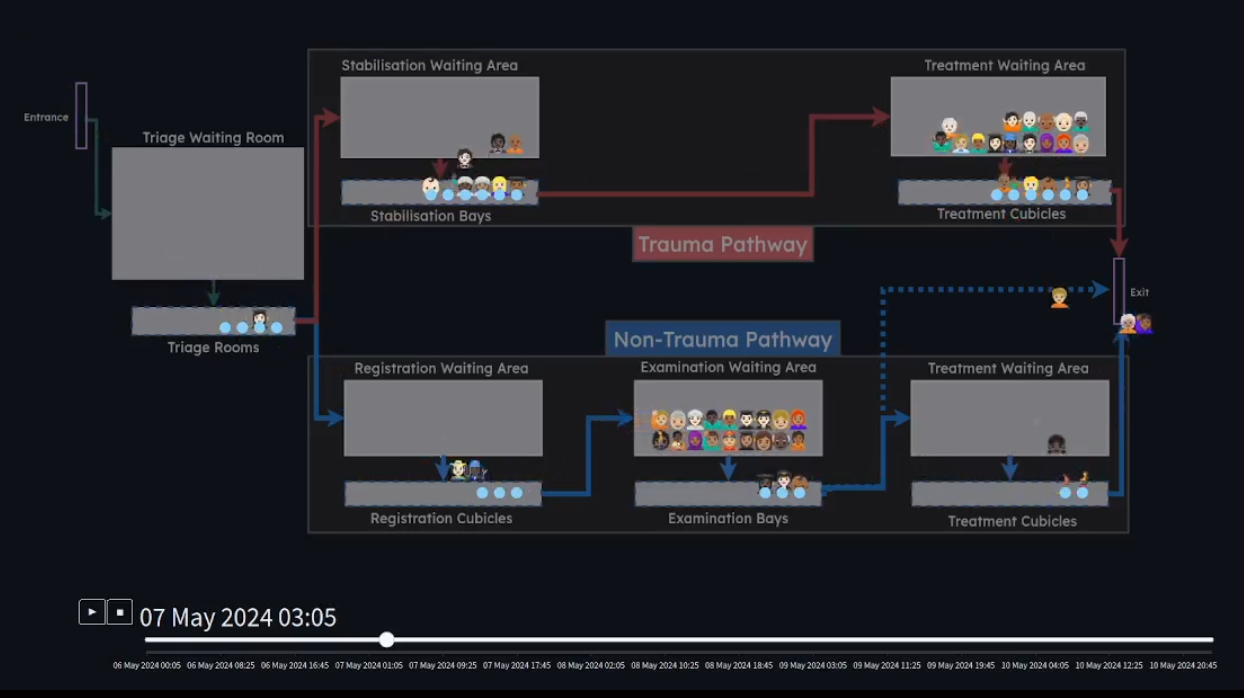
Discrete Event Simulation (DES) is a computer simulation technique, primarily used for tackling queueing problems. Healthcare systems are full of queues - both obvious ones, like in emergency departments, and more 'invisible' ones, like waiting lists for community services. DES provides a way of testing changes to demand, pathway configuration and resourcing in a safe sandbox, allowing policymakers to explore the impact of proposed changes. Using controlled randomness, DES tests whether systems will cope on good days and bad ones, making it a powerful technique for pathway improvement.
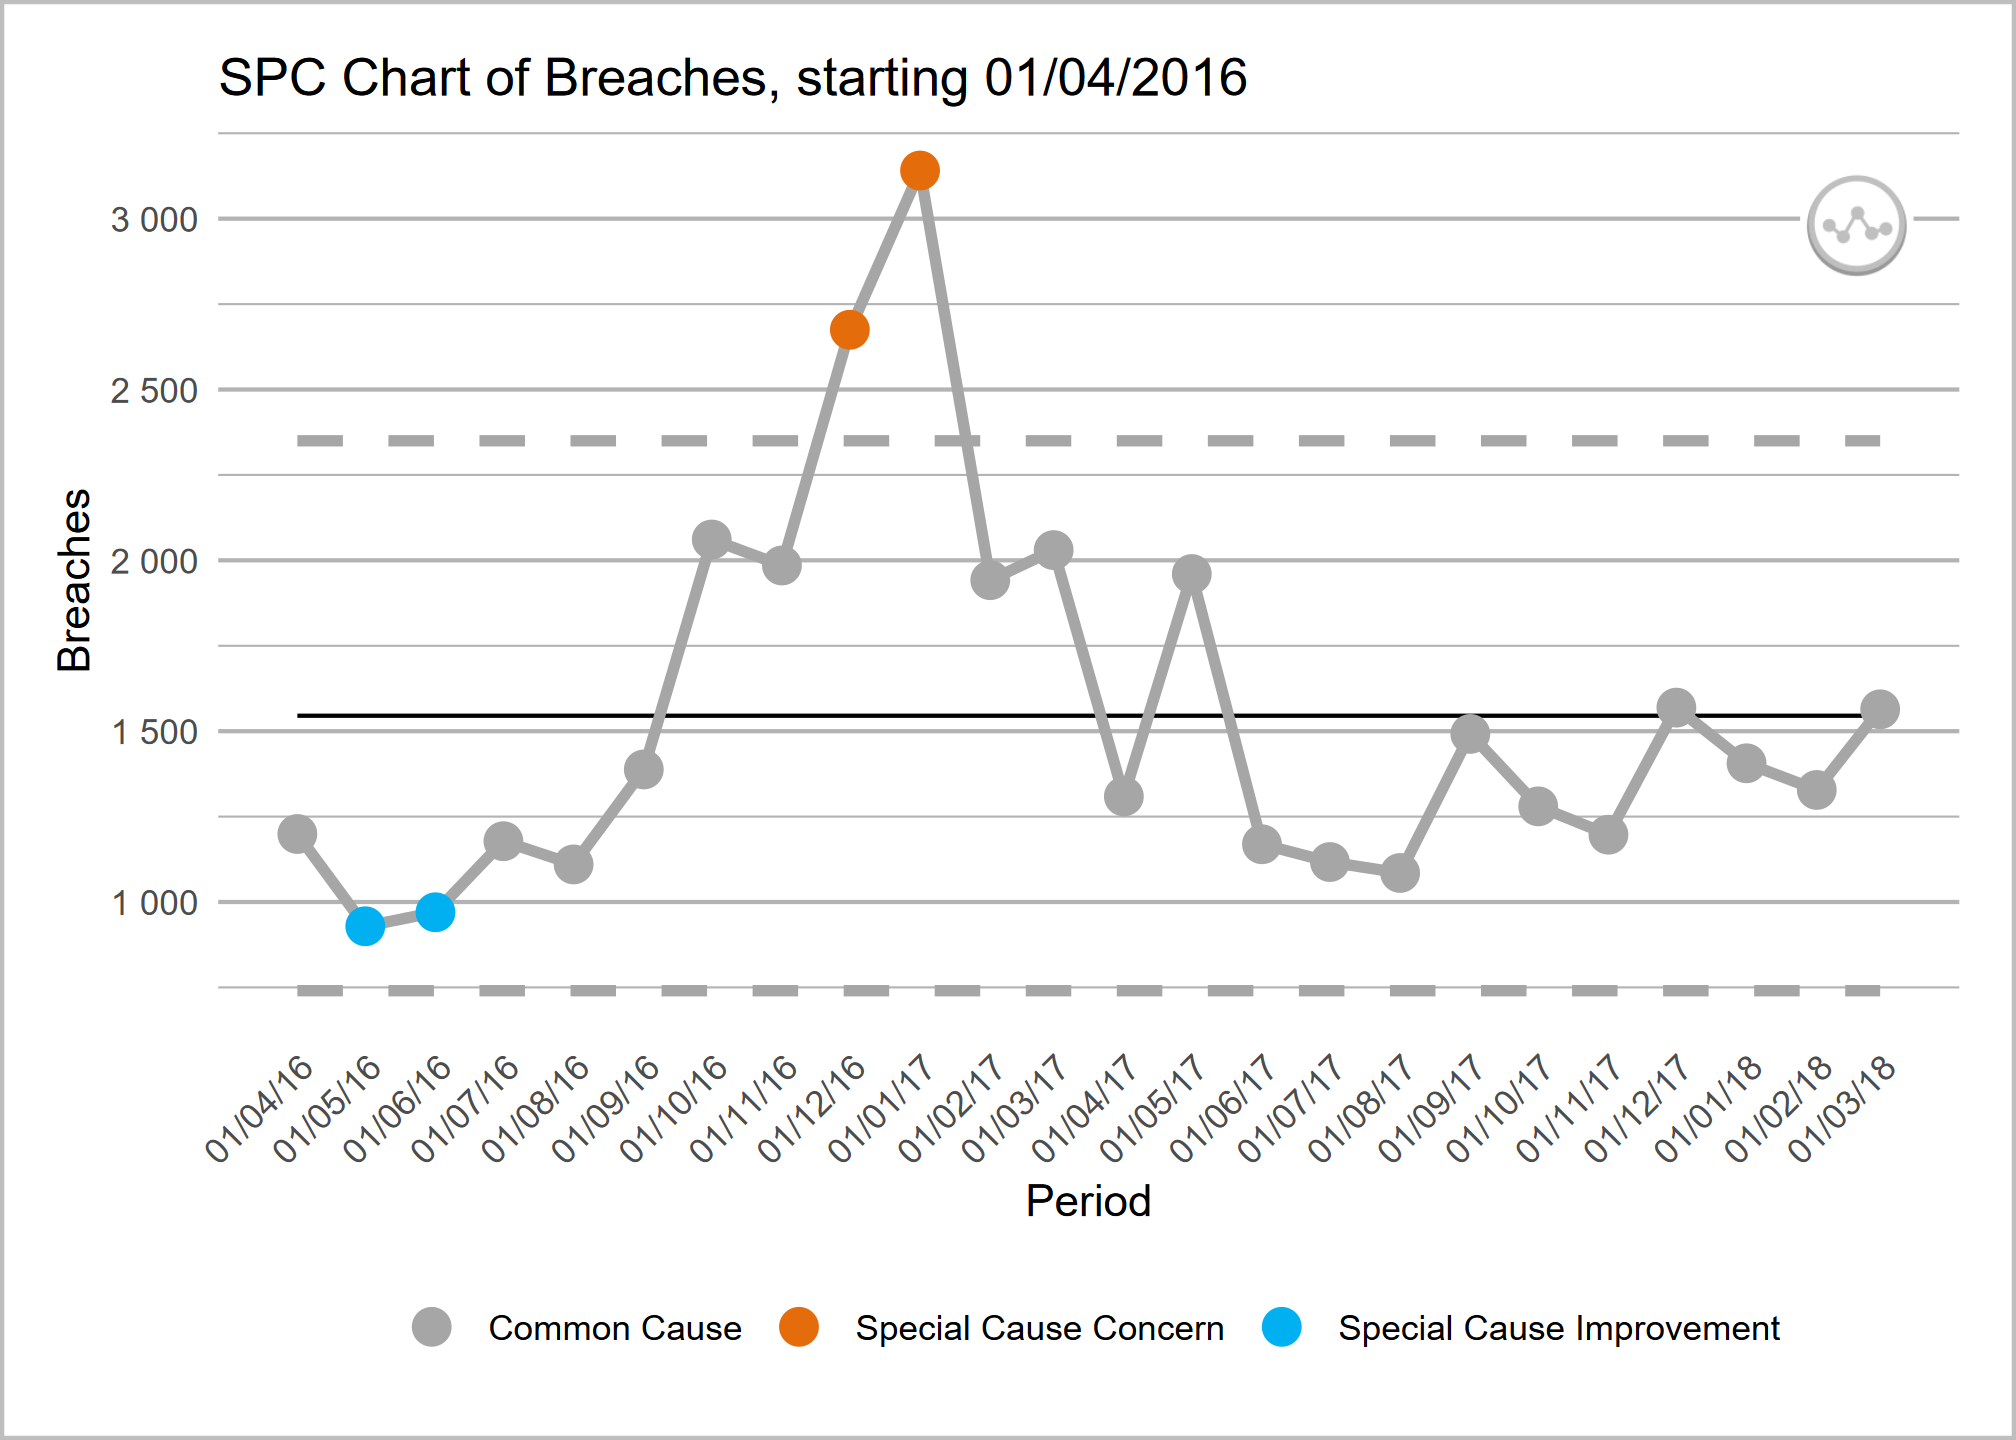
SPC charts are a useful tool for monitoring and reporting, allowing KPIs to be looked at over time and in the context of expected variation, moving away from some of the pitfalls of traditional RAG reporting and providing insights into trends and, if there is a target, whether it is likely to be reliably met.