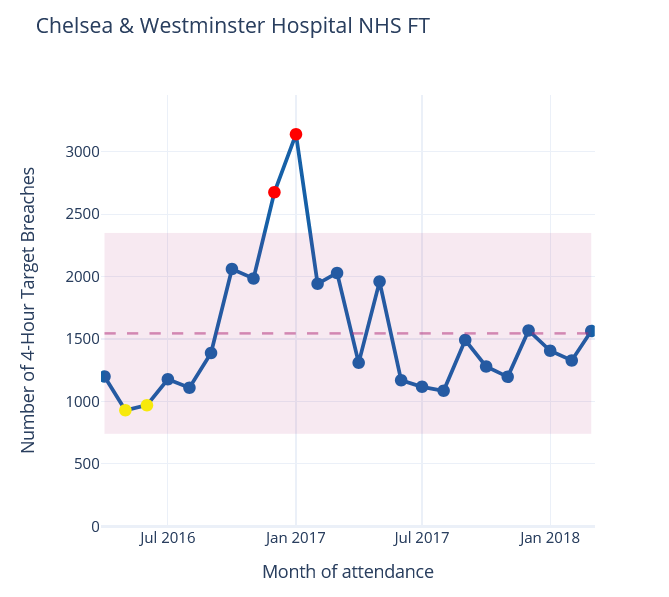
NHSpy-plotthedots is a Python package designed to make it easier to produce statistical process control (SPC) charts, which are a widely well-regarded way to report on KPIs in trusts and other organisations across the country.
More about SPC charts
Take a look at our technique page for more information about the theory behind SPC charts.
Looking for some code snippets? Head to our graph page.
Related Projects
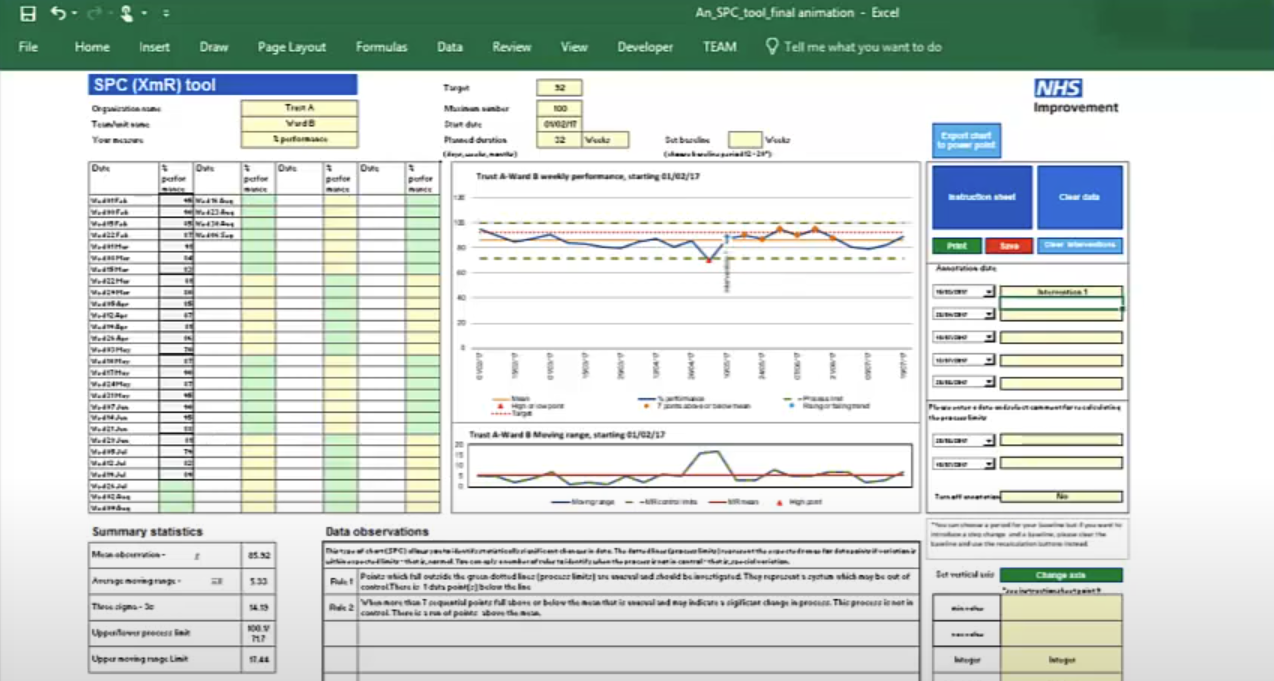
These Excel templates support the creation of statistical process control (SPC) charts adhering to the making data count rules and style. SPC charts are a good alternative to red-amber-green (RAG) rated reporting of metrics, helping to build a more informed picture of a metric's performance over time and spot signals of improvement or deterioration.
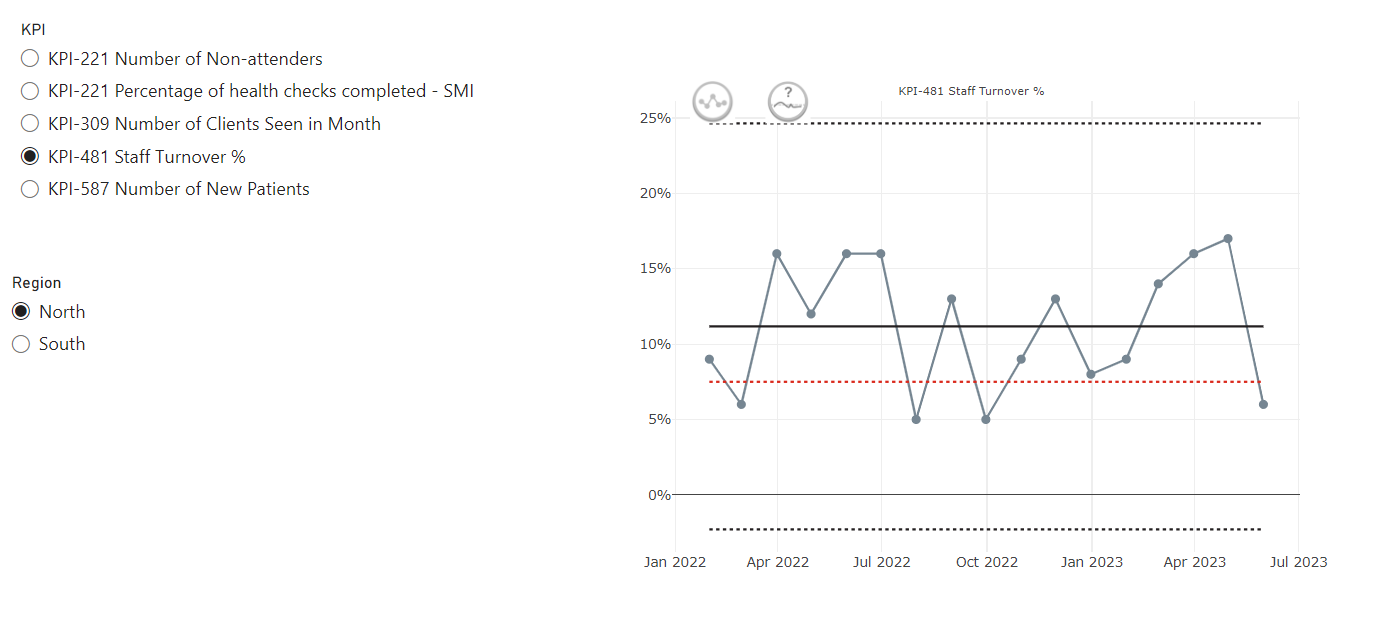
This custom PowerBI visual (based on NHSRplotthedots) simplifies the creation and automation of statistical process control (SPC) charts for KPIs. It helps analysts and teams move beyond static KPIs to understand true performance variation and identify opportunities for improvement, producing R-backed visuals within the setting of PowerBI and integrating with PowerBIs data model and filters.
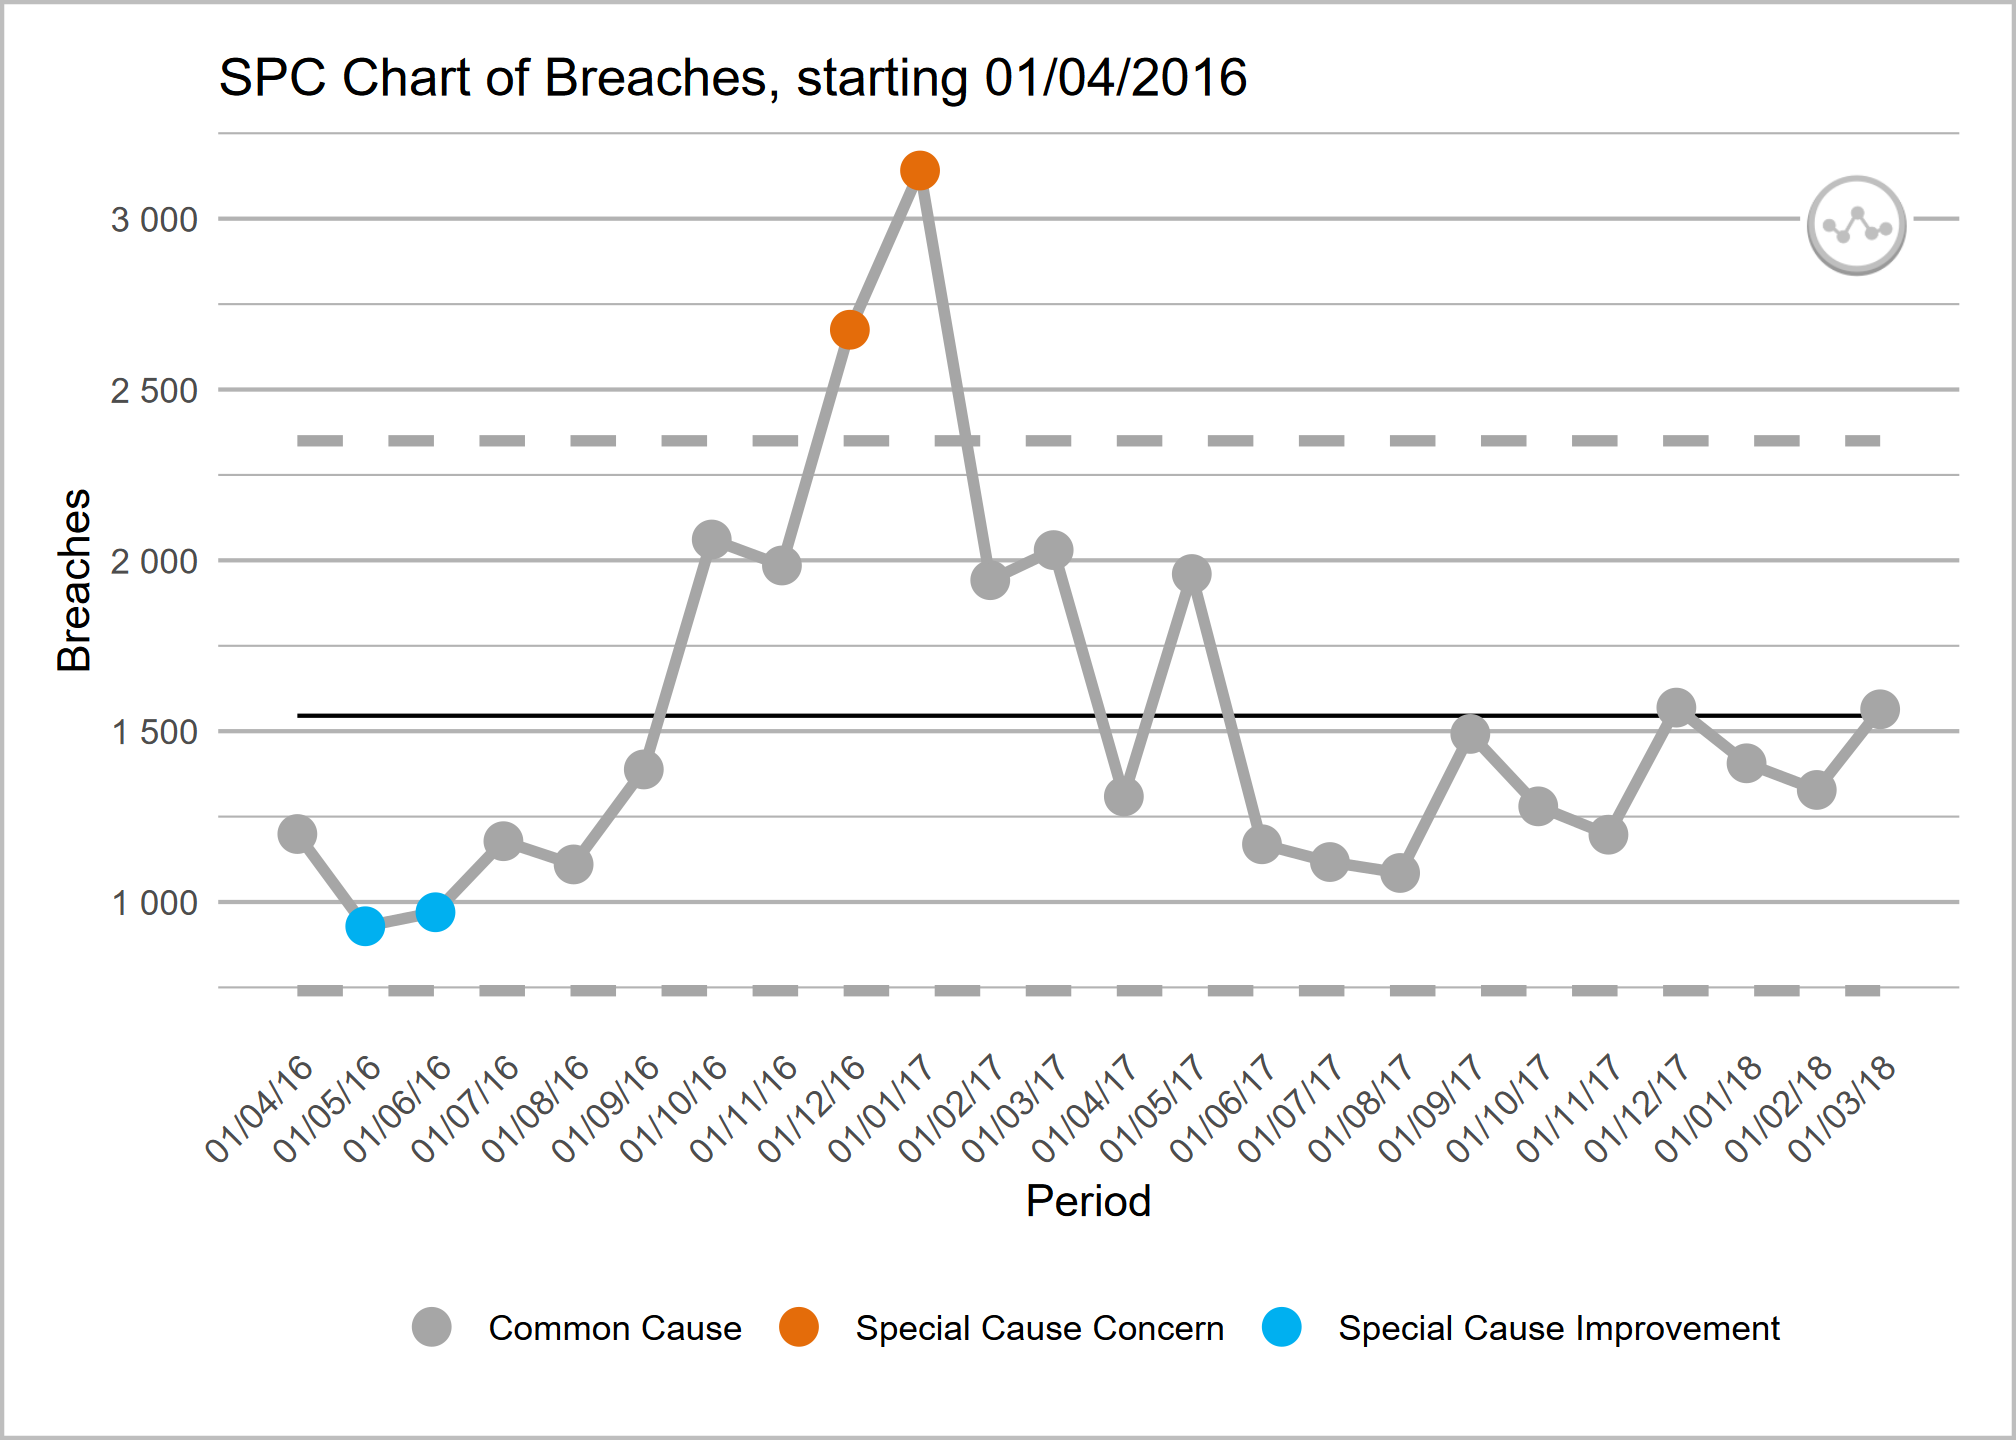
NHSRplotthedots is an R package that simplifies the creation and automation of statistical process control (SPC) charts for KPIs. It helps analysts and teams move beyond static KPIs to understand true performance variation and identify opportunities for improvement.